6. Usage dashboard
In this area, you can see your USAGE data of the used cloud resources of your account. The following reports are available for this purpose:
- Current month - Usage Standard Report current month
- Previous month - Usage Standard Report last month
- Custom query - Individual USAGE report with extensive query options (advanced)
All reports have an export function.
Note
The dates shown are indicative, time shifted 2-3 hours (e.g. CEST) depending on the time zone and may differ from your invoice dates for various reasons such as processing and rounding processes. They do not claim to be complete.
6.1. Usage Standard Reports
With the standard usage reports Current month and Previous month you can quickly get an overview of your used cloud resources.
- To do this, navigate to Usage dashboard on the left and then click on the desired standard report, for example Previous month.
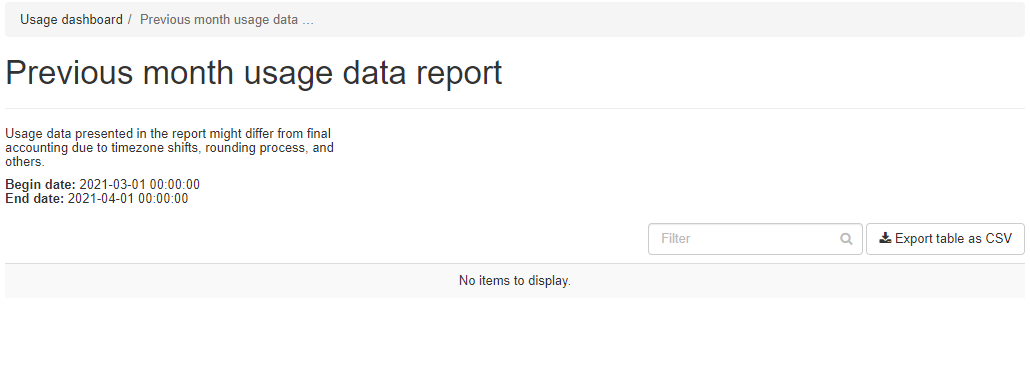
Note
If you have been using Cloud Services since the current month, understandably no data will appear in the previous month.
- Simply call the standard Usage Report Current month.
- To do this, navigate to Usage dashboard on the left and then click on Current month.
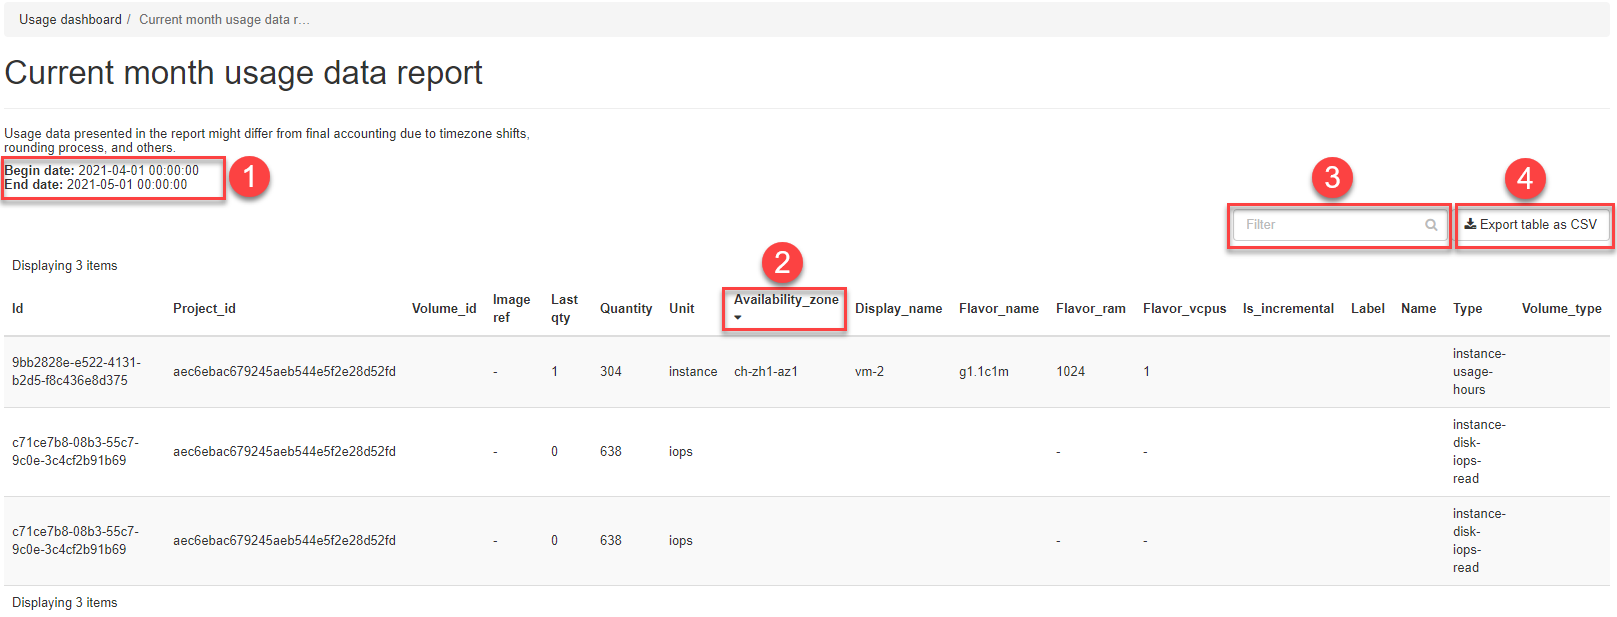
- In the upper screen you can see the date range of the query
- In the column header you can sort the displayed table as you like by clicking on a column
- A filter input field allows you to filter the table by specific text
- Clicking on the Export table as CSV button will save the report locally. Look for the icon at the bottom of the screen.
6.2. Custom Query Report
The Custom query panel allows advanced users to create custom USAGE reports with extensive query capabilities that require some understanding and knowledge of the data structure.
- To access the custom query, navigate to Usage dashboard on the left and then click on Custom query.
- Then please click on the Custom usage query button to open the query input mask.
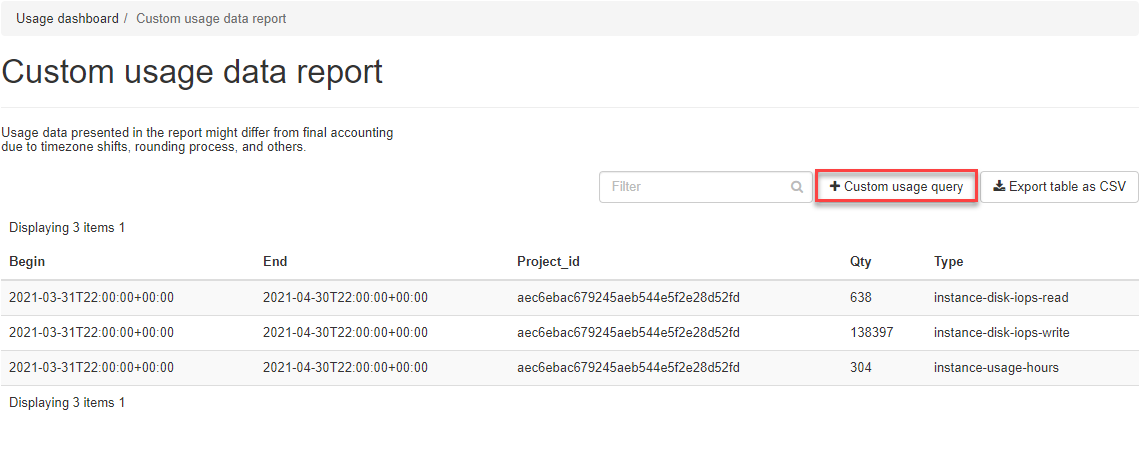
- Now enter the parameters for your query and confirm with the Store it button. This saves and executes the query.
Note
You do not have to use all input fields for a query. Start with simple queries, see examples below.
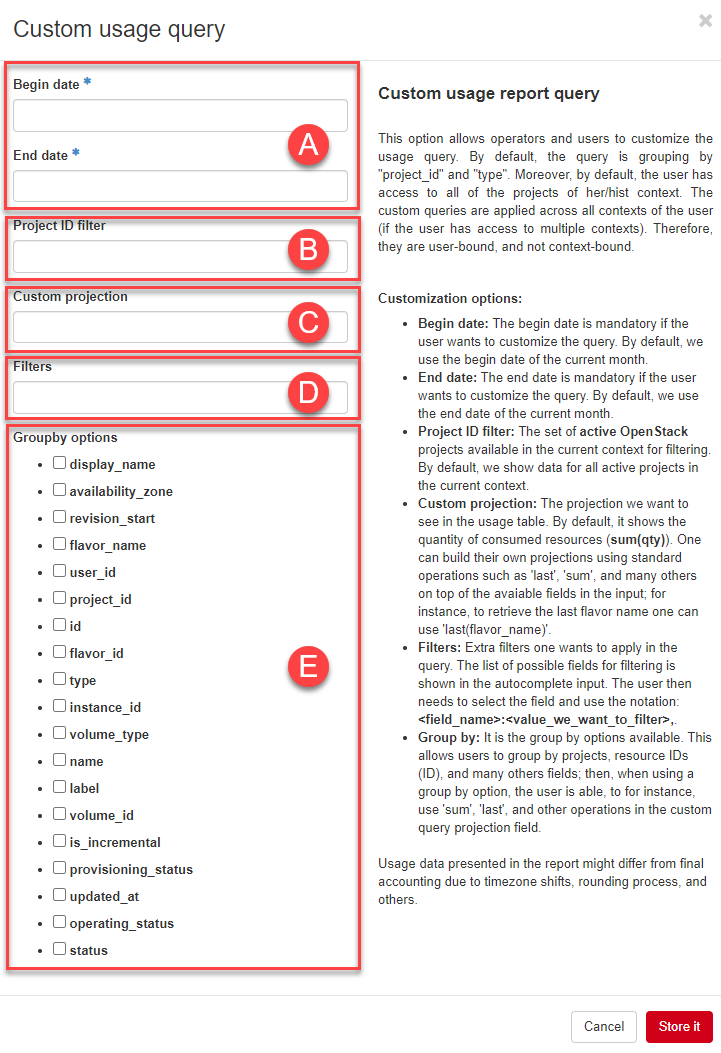
6.2.1. Custom Query Form Fields
| Input section | Description |
|---|---|
|
Please enter the time window, over which the query refers to |
|
Optionally, you can filter (limit) the query to one or more projects by entering the project name [1]. |
|
You can use this field to display other extensive fields, functions and data in the report. See examples below. |
|
Here you can enter additional filters of fields in the query in the form <field_name>:<value_we_want_to_filter>. |
|
By selecting the groupby fields, the report is displayed aggregated by these fields. Similar to SQL group by argument. |
| [1] | Entering the first letter of a project will display a list of available projects. As soon as you select one, the project_id of this project will be inserted into the field. Repeat the process to select multiple projects. |
- Clicking the Custom usage query button again displays the last query, which you can then modify if necessary.
6.2.2. Example List of all VM Instances
You want a Custom Query Report query of last month’s USAGE data from VM instances only. The list should display the following fields as columns:
- display_name
- flavor_name
- project_id
Enter the following data in the Custom Query Form and view the result.
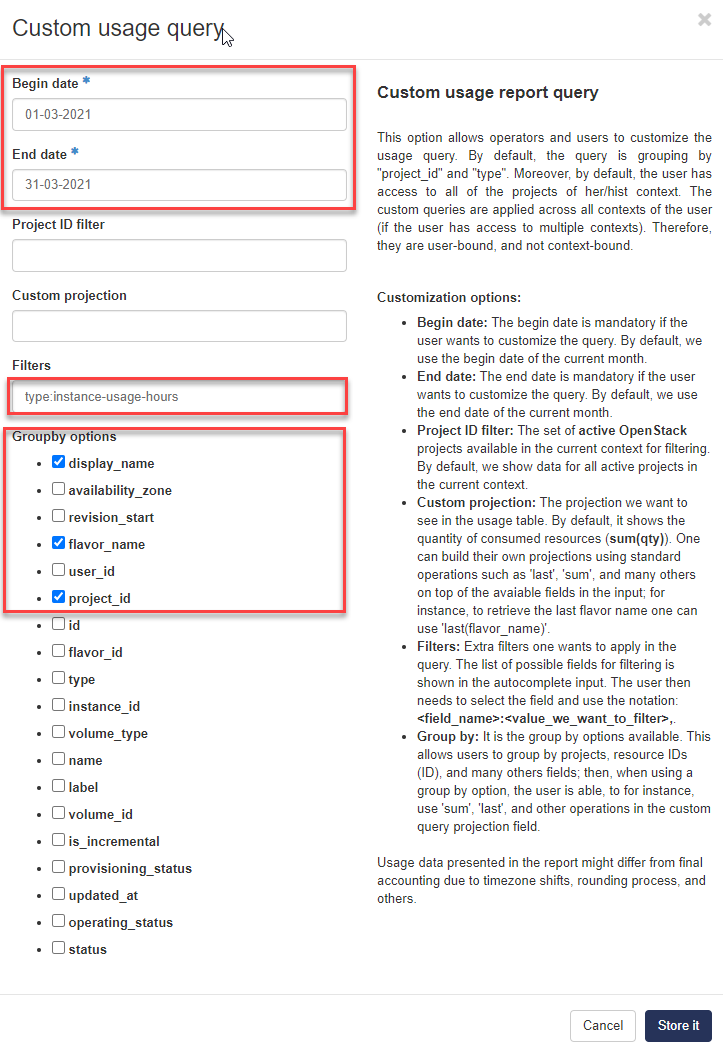
Note
By entering the filter in the form type:instance-usage-hours, only the instances are queried.